Sign In


For those who use laser diffraction as a method of particle size distribution analysis, the advent of an international standard is a very welcome aid to evaluation of results and comparison of instruments.
ISO 13320-1 or, to use its full title, ?ISO/FIDS 13320-1, Particle size analysis ? laser diffraction methods ? Part 1: General Principles?, covers a wide range of issues. Of particular interest to laboratories involved in particle size distribution analysis will be its help in relation to repeatability, accuracy, resolution and sensitivity.
Laser diffraction is a technique which has been successfully applied to particle size distribution analysis for over 30 years. It can be used for analysis in the nanoparticle size range as well as sizing and distribution of larger particles.
In a nutshell, it works by subjecting samples to electromagnetic radiation, which is scattered by the particles, and then analysing the scatter pattern mathematically to obtain information on particle sizes and distributions.
Whatever method is used for measuring nanoparticle size, or the dimensions of any other particle, one of the key problems in interpreting the results is that particles tend to be irregular in shape. Smooth spheres would be so much easier. Different approaches to defining the size of an irregular particle have included measuring the longest dimension, taking the average length of its axes or using the particle?s measured volume to work out its Equivalent Spherical Diameter or ESD.
These approaches will inevitably produce different results, but in the light of ISO 13320-1 it should be possible for analyst to understand their results more clearly and select the most appropriate solution to meet their needs.
Repeatability of results
It is essential that repeated particle size distribution analysis of the same sample should always produce the same results, whether the same instrument is used each time or, more importantly, when analyses are carried out on multiple sites in multiple locations using different instruments.
When analysing samples whose mean particle size is above 10 ?m, ISO 13320-1 specifies that the coefficient of variation for median size (x50), or for any other central value selected within the distribution range, should be less than 3%. For values on each side of the distribution, such as x10 and x90, it should not be above 5%.
In nanoparticle size analysis, and for other samples with a mean particle size under 10 ?m, the values stated above can be doubled.
Accuracy of data
The only calibration needed in laser diffraction relates to alignment of the optical system. Beckman Coulter?s simple method of ensuring reproducible alignment on the LS 13 320 uses a reticule.
The reticule is a metal plate in which a hole has been precision-drilled. This hole, which acts as an ?ideal particle?, can be used to ensure that the laser and the detector array are perfectly aligned. Crucial to reproducibility is the fact that the alignment is carried out automatically, rather than by an operator.
At nanoparticle size the alignment is not quite so critical but with large particles the scattering characteristically displays discrete and well-defined minima, at low angles relative to the optical path, which can substantially alter the distribution if there is even a small misalignment.
Resolution and sensitivity of analysis
The key factors affecting resolution and sensitivity, as specified in ISO 13320-1, are dealt with in turn below.
Detector elements: number, position and geometry
The resolution of the instrument depends on its ability to detect the pattern of light intensity, as a function of angle, produced as the electromagnetic radiation is scattered by the particles.
Almost all laser diffraction particle size distribution analysis instruments use arrays of silicon-based photodiodes for this detection, and it stands to reason that a larger number of detectors will produce a higher resolution. Beckman Coulter?s LS 13 320 has no fewer than 126 detectors.
In addition, for nanoparticle size measurement, and other analyses in the sub-micron range, Beckman Coulter?s own Polarisation Intensity Differential Scattering (PIDS) technology offers a further 42 datum points.
For complete interpretation of the scattered light, Beckman Coulter has developed a highly efficient X-shaped and log-spaced design for its array.
Ratio of signal to noise
The larger the surface area of the detector, the better is its ability to measure light intensity ? and therefore the better is its signal to noise ratio. A compromise is needed, as increasing their size limits the number of detectors that will fit into an array.
In practice, the array?s electronics can mitigate this limitation. In most instruments, detector planes are periodically swept so that the analysis involves taking small time slices. The LS 13 320 has unique, continuous signal-processing circuitry which allows all of the scattered light to be measured.
Measured scattering pattern: fine structure
To observe every detail of the particle size distribution, an instrument must be able to detect very small differences in light intensity as a function of angle. The LS 13 320 scores highly in this respect.
Difference in scatter pattern between size classes
In a particle size analysis where, for example, a small quantity of oversized material is present along with the main distribution, the instrument needs to be able to discriminate between them. The LS 13 320 has the necessary sensitivity and resolution to do so.
Actual size range of particles
Different size classes of particle will scatter light in different ways. For example, 20 ?m particles scatter light with a high intensity in the forward direction, at low angles in relation to the beam path of the irradiation. This makes their maxima and minima relatively easy to measure. However, when dealing with items of nanoparticle sizing (0.1 ?m and below), the scattering signal is weak and minima cannot be measured even at 90 degrees.
Beckman Coulter?s PIDS technology has been specifically developed to deliver high resolution in the nanoparticle size range.
Adequacy of the optical model
It should be noted that while use of the Fraunhofer optical model gives reliable results for particles measuring 50 ?m and above, the more rigorous Mie theory is to be preferred for smaller particles ? including those of nanoparticle size.
Deconvolution procedure: smoothing
The complex mathematical process on which particle size analysis by laser diffraction depends involves a number of assumptions and a degree of smoothing.
Beckman Coulter, in its LS 13 320, bases its assumptions on pre-analysis of collected raw data. In contrast, other manufacturers give users a menu of options and allow them to decide for themselves. In all but the simplest applications, this can potentially lead to misinterpretation of the results obtained.
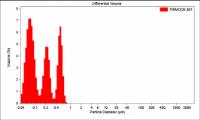
In comparing results between the LS 13 320 and one of its competitors, using an independently produced trimodal control sample, Beckman Coulter has demonstrated just how different the results can be. Only the LS 13 320, with its PIDS technology, could provide resolution in the nanoparticle size range, but the competitor?s instrument also produced very different results depending on what assumptions were made by the user.
Would you like to know what we can do for you. Please contact us.
For more information on Particle Size Distribution Analysis and nanoparticle size talk to Meritics Ltd
Enquire Now
List your company on FindTheNeedle.