 Add My Company
Sign In
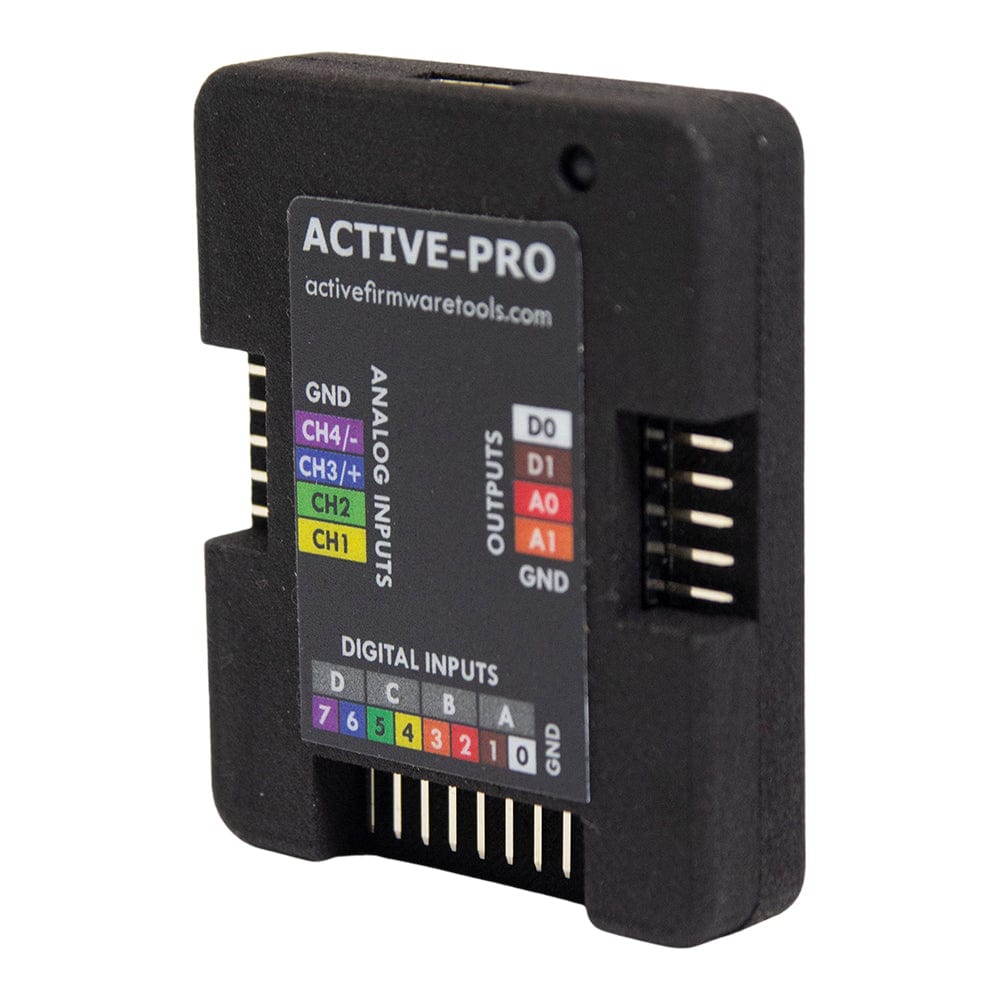
Active-Pro Firmware Debugger
Product Code: AP-FD

Introducing the Active-Pro Firmware Debugger
Are you tired of spending countless hours debugging your embedded firmware systems? Look no further than the Active-Pro Firmware Debugger - the ultimate tool for debugging today's systems.
Clear and Concise Insight
The Active-Pro Debug Toolbox provides you with clear, concise insight into your design's operation, enabling you to find and fix bugs quickly. It captures and displays Logic Analyzer digital data, Oscilloscope analogue data, I2C, SPI, and UART decoded data. With its new interface, the Active-Pro Firmware Debugger gives you an unparalleled view of your system.
Simple Interface
The Active-Pro Firmware Debugger uses a simple 1-wire (UART) or 2-wire (GPIO) interface to your firmware, using simple string output calls such as c printf, c++ cout, Python print(), and more. This interface provides access to data not on an external bus and shows you only your embedded firmware knows the internal information.
Streamlined Data Capture
The Active-Pro Firmware Debugger streams data to disk, allowing you to capture data that can outlast you. This ensures that your elusive bug is captured and that you can quickly and easily debug your system with up to four MCUs simultaneously.
Invest in the Active-Pro Debug Toolbox and take your embedded firmware debugging to the next level.
For more information on Active-Pro Firmware Debugger talk to Debug Store
Enquire Now
List your company on FindTheNeedle.
